For much too long, the principal measures of educational quality were inputs: budgets, teacher salaries, class sizes, pupil/teacher ratios, and the like. Grades did not compare from school to school or even class to class. Specialized tests such as the SAT reached only limited numbers of students and, in the SAT case, measured intelligence rather than achievement.
This situation was disrupted in 2002 by the No Child Left Behind Act, which conditioned Title I federal support on statewide testing. Whatever their other strengths and weaknesses -- see, e.g., the Wikipedia discussion -- the resulting testing schemes gave us measures of outputs.
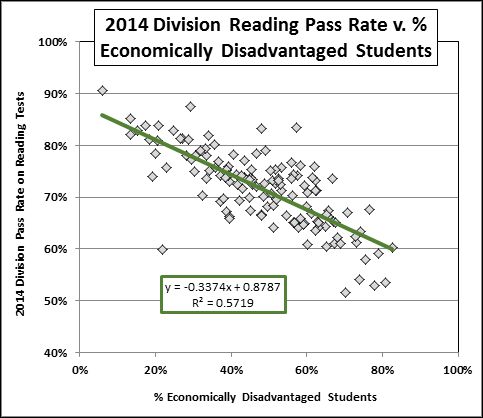
The scores, however, were strongly dependent on the economic status of the students being tested. For example, on Virginia’s 2014 English Reading SOL tests, a 10% increase in the division count of economically disadvantaged students was associated with a 3.4% decrease in the division average pass rate.

(Click for more legible image.)
Stated briefly, the SGP compares the progress (year-to-year score change) of each student with the other students in the state who had similar prior scores. That progress then is expressed as a percentile ranking. Thus, a student with a 60 SGP had a score increase better than 60% of the students with the same “prior achievement.”
The Virginia Department of Education (VDOE) has a page of discussion with further links here. A 2011 PowerPoint from VDOE’s Director of Research and Strategic Planning has a very clear discussion.

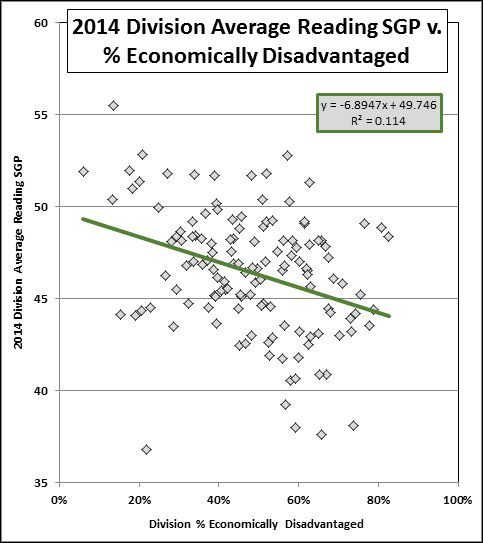
(Click for more legible image.)
The advantage of the SGP is that it compares students with peers as to achievement. Thus, students with low SOL’s (and, likely, low family wealth) are compared with students in similar circumstances. The Virginia reading data demonstrate how this produces data that are largely independent of economic disadvantage.
Note here the weak correlation (11% R2, vs. 57% for the SOL chart above) and the weaker effect of economic disadvantage (14% SGP decrease compared to a 38% decrease in the SOL).
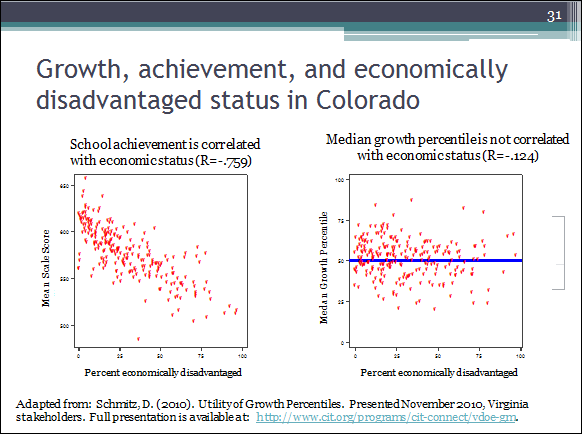
Data elsewhere show an even weaker relationship between SGP and economic disadvantage:
To the bad, the SOL score is imprecise to some degree. VDOE has a mind-numbing discussion here. For the present, it is enough to notice that taking the difference between two SOL scores to calculate an SGP produces a datum that is even less precise than either of the two SOL data. Thus, any single SGP, or any small collection, is weak evidence as to the teacher, school, or division.
All that said, Virginia has been calculating SGPs since 2011 for most students (about 70%) who take the SOL tests for reading and math in grades 4-8 and Algebra I through grade 9. VDOE has data that can be used, albeit with caution, to evaluate the progress of individual students and the effectiveness of their teachers, their schools, and their school divisions.
Yet Brian Davison, a parent of a Loudoun County school student, had to sue VDOE to get the Loudoun County data. Fortunately for us, Brian also got the statewide data by school and by division (posted here; the 16709 set is more current). He still is litigating the data by teacher (the teachers’ union and, to their shame, the Loudoun School Board and VDOE are trying to suppress these data).

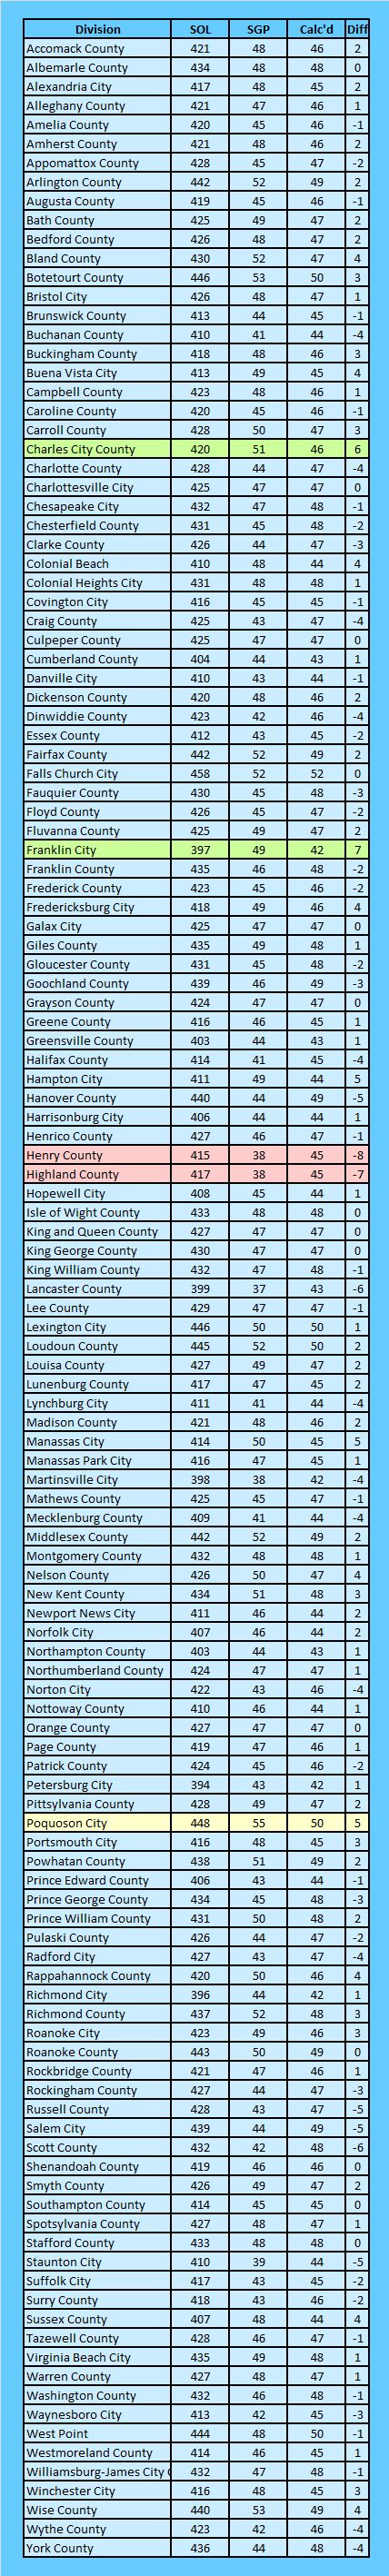
(Click for more legible image.)
The 2013-14 dataset (the latest of three) occupies 833 MB when imported into Microsoft Access. There’s a lot of information there. For a start, here are graphs of the 2013-14 division fifth grade reading SGP v. SOL scores. Caution: These are not the division average SOLs, but the division averages of the SOLs of students for whom VDOE calculated an SGP.
To the point here, Franklin City and Charles City County, the green points, are taking students with low and nearly average SOLs and achieving large gains in reading. Poquoson, the yellow point, is doing the same thing with high-SOL students. At the red points, Henry and Highland counties, in contrast, are the leading underachievers in this group. (To view the data for each school division, click here.)
This graph is a snapshot that shows only one subject in only one grade for one year, but it makes two important points:
- We now have data that can measure year-to-year improvement in the SOL scores by division and by school. If Brian can win his suit, we’ll have the data parents will want, by teacher.
- Some divisions are teaching a lot to students with low achievement. If Franklin City can do that, so can the schools in your division and mine! No wonder the teachers’ union and the Loudoun School Board want these data suppressed.
For a sample of the further kinds of analyses available, see the data here and here and here.
If you would like to dig into your own school division, pull down the raw data from Brian’s post. You’ll need to strip out the SOL scores for students for whom VDOE did not calculate the SGP. Unless you’re a database whiz, you’ll also need to restrict the dataset (probably by year) to get under Excel’s 1.024 million row limit.
Or, even better, you can demand that your School Board analyze and post its results.
Here’s the 8th Grade Reading table. The "Diff" column shows how many percentage points above or below the calculated number (“Calc’d”) is above or below the fitted line indicating the norm. The higher the positive number, the greater the positive number, the more the school division out-performs its peers; the greater the negative number, the more the school division under-performs.
|
|

No comments:
Post a Comment
Remember: I will review all comments before posting and if you wish your information to remain confidential, please know that I will honor your request.