By John R. Butcher
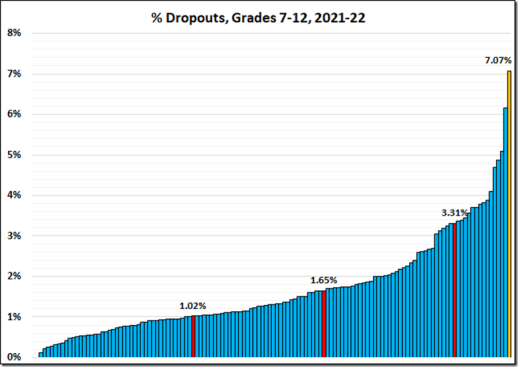
A kind reader tells me that Table 6 in the Superintendent’s Annual Report is up with the 2021-22 division dropout count totals for Grades 7-12. Juxtaposing those data with the 2021-22 fall enrollments produces the following distribution.
The red bars, from the left are Hampton, Newport News, and Norfolk. The gold bar is Richmond. The division average is 1.68.
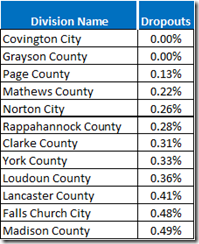
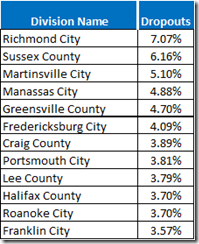
Here are the top and bottom dozen divisions.
Here is the entire list.
A forum to discuss Richmond, VA Public Schools and the politics of the City of Richmond
Sunday, January 22, 2023
What Do They Learn When They’re Not In School?
Subscribe to:
Post Comments (Atom)


No comments:
Post a Comment
Remember: I will review all comments before posting and if you wish your information to remain confidential, please know that I will honor your request.